Let's follow their conversation and find out if Climate Change is real or not.
By Mihir Gandhi, Shravika Mittal, and Ananya Malik. December, 2021
Not so long time ago, in a galaxy not so far away, two opposing forces met.
Doland and Gerta
Doland, a firm believer that climate change is just a hoax, and Gerta, a staunch advocate of immediate actions to mitigate climate change.
"CLIMATE CHANGE IS NOT REAL!"
exclaimed Doland.
Most of these climate changes are attributed to very small variations in Earth’s orbit that change the amount of solar energy our planet receives. The current warming trend is of particular significance because it is unequivocally the result of human activity since the mid-20th century and proceeding at a rate that is unprecedented over millennia. It is undeniable that human activities have warmed the atmosphere, ocean, and land and that widespread and rapid changes in the atmosphere, ocean, cryosphere, and biosphere have occurred.
This graph illustrates the Global Temperature Anomaly relative to the 20th century average from 1895-2019. Eighteen of the hottest years have occurred since 2000, with the exception of 1998, which was helped by a very strong El Niño. The year 2016 was the hottest year on record since record-keeping began in 1880.
Earth's climate has changed throughout history. Just in the last 650,000 years there have been seven cycles of glacial advance and retreat, with the abrupt end of the last ice age about 11,700 years ago marking the beginning of the modern climate era — and of human civilization.
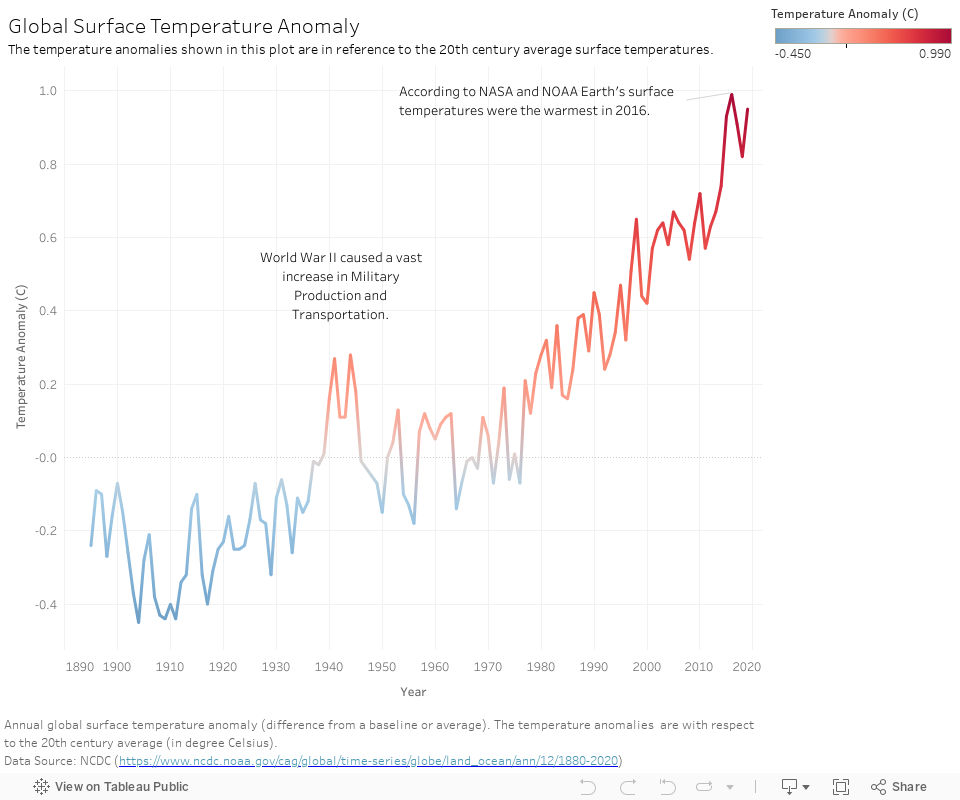
It is evident that the global surface temperature has increased from 1895 to 2019. There is an evident increase during the period of World War II (1939 - 1945) because of rise in activities like transportation and military production. After World War II, the world entered the period of the Third Industrial Revolution, causing a steady increase in global surface temperatures owing to globalization. 2016 was noted by NASA and NOAA to be a record-breaking year for having the warmest surface temperature [Source: NASA].
"So, the Earth's average temperature has increased about 2 degrees Fahrenheit during the 20th century. What's the big deal?"

"Two degrees may sound like a small amount, but it's an unusual event in our planet's recent history. Earth's climate record, preserved in tree rings, ice cores, and coral reefs, shows that the global average temperature is stable over long periods of time. Furthermore, small changes in temperature correspond to enormous changes in the environment. For example, at the end of the last ice age, when the Northeast United States was covered by more than 3,000 feet of ice, average temperatures were only 5 to 9 degrees cooler than today!"

Grey Glacier in Patagonia, Chile
May 2016
November 2016
October 2017
"It's freezing in New York - where the hell is global warming?"
"The annual average temperature of USA has increased by 1.3C (2.4F) from 1895 to 2019.
Have a look for yourself!"

The average temperature of USA has increased from 1895 to 2019 by 1.3 degree Celsius. This trend of increasing annual temperature for USA is in line with the increasing global surface temperatures. After the end of World War II, the United States opened themselves to industrial production and urbanization causing the temperatures to have a rising trend 1970 onwards. The 2008 financial crisis caused a huge dip in the average temperature for the United States probably due to a decline in industrial production and manufacturing sectors. The recovery from this economic crisis 2009 onwards, once again fueled industrialization, causing temperatures to rise thereafter.
The following visualization shows the statewise temperature change from 1895 to 2019. All of the lower 48 states have witnessed an increase in temperature with the exception of Alabama. We have highlighted the top 3 tech hubs: California, New York, and Georgia.

The temperature change from 1895-2019 varies across different states in the United States. Rhode Island has experienced the highest increase in temperature. Interestingly, Alabama is the only state that has a decrease in temperature from 1895 to 2019. The states present in the south are warmer and they have experienced a lower temperature change as compared to the colder states in the north and the east that have experienced a higher temperature change. Studies show that in general the northern hemisphere warms up faster as compared to the southern hemisphere as it has more landmass, and water takes up longer to heat than land [Source: NRDC].
"You see all that Red? There has been an increase in average temperature from 1895 to 2019 in all contiguous US states with the exception of Alabama!"
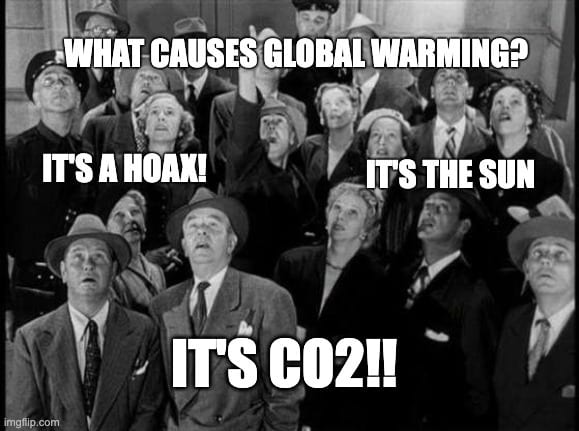
"The weather has been so cold for so long that I thought Global Warming Hoaxsters just changed the name to Climate Change. Tell me one thing, isn't it natural? Sun is the fundamental source of energy that drives our climate system and it's energy output may cause the climate to change! "


"Indeed, studies show that solar variability has played a role in past climate changes. But since 1750, the average amount of energy coming from the Sun either remained constant or increased slightly. If the warming were caused by a more active Sun, then scientists would expect to see warmer temperatures in all layers of the atmosphere. Instead, they have observed a cooling in the upper atmosphere, and a warming at the surface and in the lower parts of the atmosphere. That's because greenhouse gases are trapping heat in the lower atmosphere."
"So if it's not the sun, what is causing this increase in temperature? "
We Live in a Greenhouse. Life on Earth depends on energy coming from the Sun. About half the light reaching Earth's atmosphere passes through the air and clouds to the surface, where it is absorbed and then radiated upward in the form of infrared heat. About 90 percent of this heat is then absorbed by the greenhouse gases and radiated back toward the surface. Let look at the last 30 years in more detail.
Scientists attribute the global warming trend observed since the mid-20th century to the human expansion of the "greenhouse effect" - warming that results when the atmosphere traps heat radiating from Earth toward space.
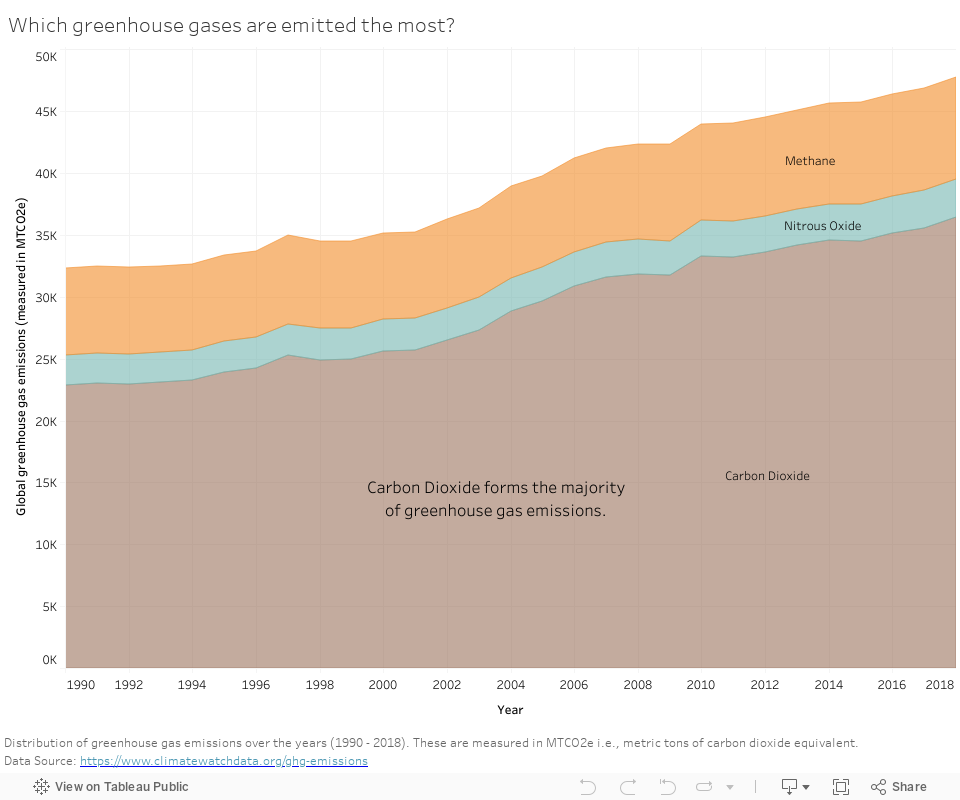
It can be observed that the amount of emissions have been increasing for CO2, Methane, and N20 over the last 30 years. Carbon Dioxide forms the majority of greenhouse gas emissions owing to the increased industrialization, globalization, and burning of fossil fuels. Although Nitrous Oxide and Methane emissions are less in comparison, studies have shown that they are much more harmful in terms of their impact on climate change [source: TheConversation].
In its Fifth Assessment Report, the Intergovernmental Panel on Climate Change, a group of 1,300 independent scientific experts from countries all over the world under the auspices of the United Nations, concluded there's a more than 95 percent probability that human activities over the past 50 years have warmed our planet.
The industrial activities that our modern civilization depends upon have raised atmospheric carbon dioxide levels from 280 parts per million to about 417 parts per million in the last 151 years. The panel also concluded there's a better than 95 percent probability that human-produced greenhouse gases such as carbon dioxide, methane and nitrous oxide have caused much of the observed increase in Earth's temperatures over the past 50-plus years.
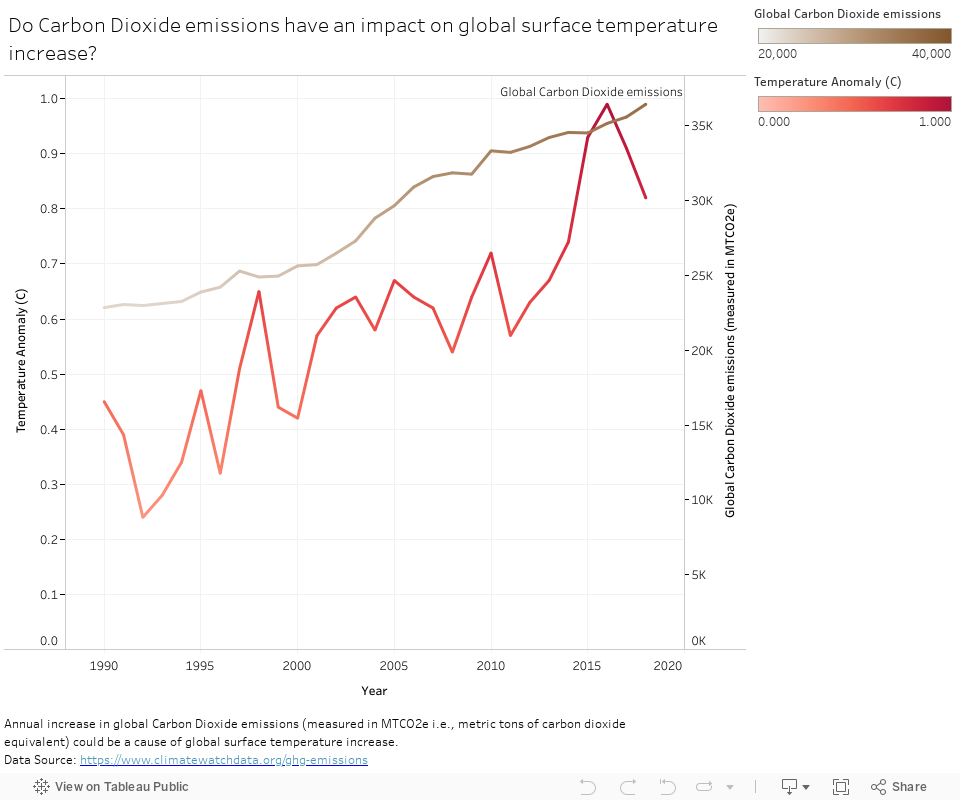
This visualization captures the relationship between Carbon Dioxide emissions and their impact on global surface temperatures. Both Carbon Dioxide emissions and global surface temperatures have an increasing trend over the past 30 years. This visualization confirms the theoretical evidence of how greenhouse gases capture the surface heat due to the greenhouse effect, causing the Earth’s surface temperature to rise.

Countries over the world vary in their contribution towards Carbon Dioxide emissions. The above visualization highlights the top 10 countries responsible for the production of Carbon Dioxide. An interesting observation is that the carbon dioxide emissions for the United States have been declining over the past few years. This decline mainly began in 2008, the beginning of President Obama’s tenure. During his presidency, there was a significant decrease in Carbon Dioxide emissions owing to the shift from fossil fuels to renewable energy sources [Source: ClimateChangeNews]. The United States continues to remain the second-highest emitter of Carbon Dioxide, despite the recent decrease in emissions. The boom of urbanization in China has made it become the highest emitter of Carbon Dioxide across the globe. Interestingly, if we look at the percentage contribution of countries towards the total amount of Carbon Dioxide emissions it can be observed that the top 10 emitting countries are responsible for more than 60% of the total Carbon Dioxide emissions.
The diagram below focuses on the top 5 Carbon Dioxide emitting countries: China, United States, India, Russia, and Japan [Source: Investopedia] for the year 2018. It shows the distribution of Carbon Dioxide emissions for these countries across 5 causes.
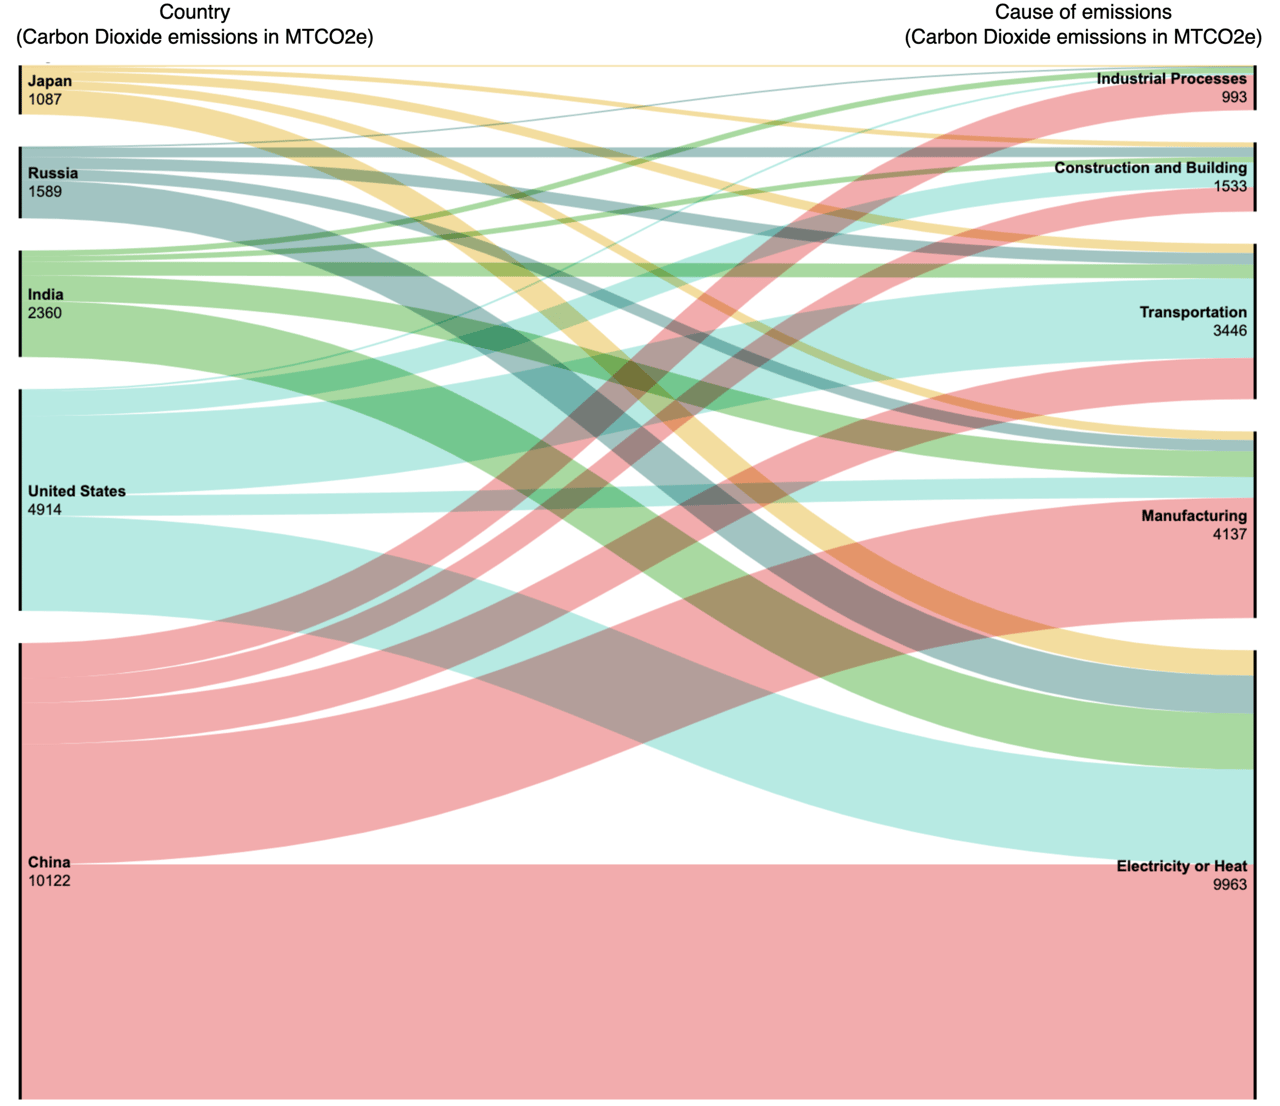
Electricity, Manufacturing, and Transportation are the main causes of the production of Carbon Dioxide. For China, a majority of its Carbon Dioxide emissions come from burning fossil fuels (especially coal) to generate electricity for running the industrial power plants. For United States, the transportation industry relies a lot on petroleum, diesel, and gasoline, significantly increasing the carbon footprint of the country. Owing to an increase in industrialization, India heavily depends on burning coal to generate electricity for running its heavy industries. Like India, Russia and Japan depend heavily on combustion of coal and natural gases for the production of electricity to run their power plants. Analysts have suggested that the carbon footprint of Japan might stabilize once the nuclear power plants reopen again.
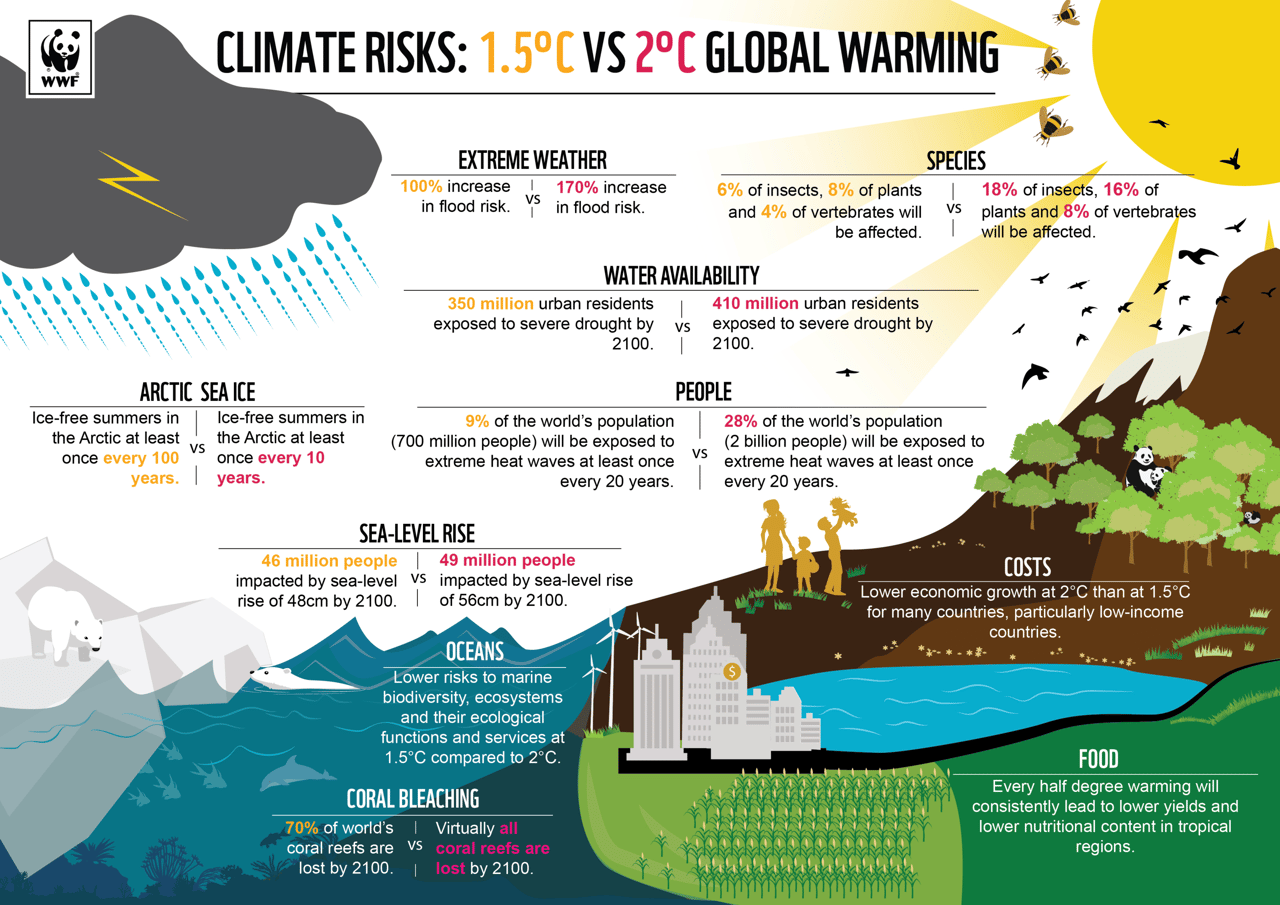
"The environment is very important to me. What are the effects of climate change?"
"That's a HOT research area! The effects of ocean warming include sea level rise due to thermal expansion, coral bleaching, accelerated melting of Earth’s major ice sheets, intensified hurricanes, and changes in ocean health and biochemistry."
Refuge Island, Indonesia
2012
2018
This graph follows the mean cumulative mass balance of glaciers and the mean sea level from the year 1993 to 2014. In this graph we can see that as we go across the years, the mean sea level rises and the mean cumulative mass balance reduces. This substantiates the claim that due to global warming, our glaciers are melting and the sea level is rising which may lead to the sinking of major cities around the world.
Ocean heat content
Ninety percent of global warming is occurring in the ocean, causing the water’s internal heat to increase. Heat stored in the ocean causes its water to expand, which is responsible for one-third to one-half of global sea level rise. Most of the added energy is stored at the surface, at a depth of zero to 700 meters. The last 10 years were the ocean's warmest decade since at least the 1800s.
The effects of ocean warming include sea level rise due to thermal expansion, coral bleaching, accelerated melting of Earth’s major ice sheets, intensified hurricanes, and changes in ocean health and biochemistry.
Increase in Frequency and Severity of Climate Extremes
Droughts and heat waves everywhere are projected to become more intense, and cold waves less intense everywhere. Hurricane-associated storm intensity and rainfall rates are projected to increase as the climate continues to warm.
Such climate extremes can lead to crop losses and threaten the livelihoods of agricultural producers and the food security of communities worldwide. Depending on the crop and ecosystem, weeds, pests, and fungi can also thrive under warmer temperatures, wetter climates, and increased CO2 levels, and climate change will likely increase weeds and pests.
Global climate change has already had observable effects on the environment. Glaciers have shrunk, ice on rivers and lakes is breaking up earlier, plant and animal ranges have shifted and trees are flowering sooner.
Effects that scientists had predicted in the past would result from global climate change are now occurring: loss of sea ice, accelerated sea level rise and longer, more intense heat waves.
The consequences of changing the natural atmospheric greenhouse are difficult to predict, but some effects seem likely:
Change Will Continue Through This Century and Beyond
Global climate is projected to continue to change over this century and beyond. The magnitude of climate change beyond the next few decades depends primarily on the amount of heat-trapping gases emitted globally, and how sensitive the Earth’s climate is to those emissions.
Sea Level Will Rise 1-8 feet by 2100
Sea level rise is caused primarily by two factors related to global warming: the added water from melting ice sheets and glaciers and the expansion of seawater as it warms.
In the next several decades, storm surges and high tides could combine with sea level rise and land subsidence to further increase flooding in many regions. Sea level rise will continue past 2100 because the oceans take a very long time to respond to warmer conditions at the Earth’s surface. Ocean waters will therefore continue to warm and sea level will continue to rise for many centuries at rates equal to or higher than those of the current century.
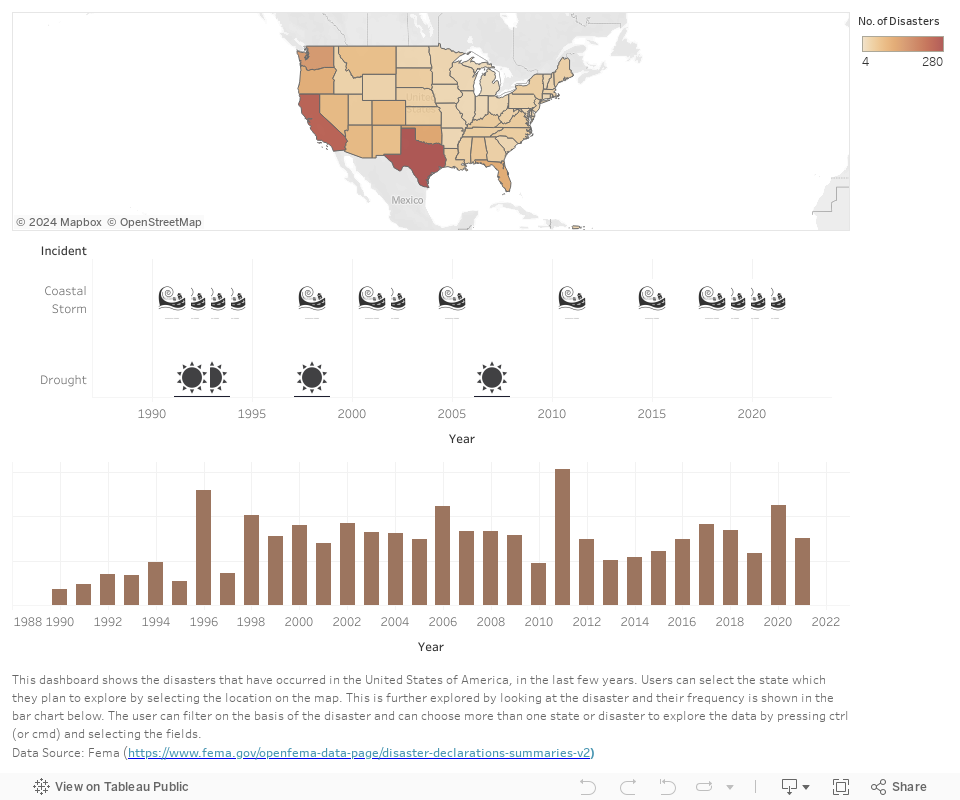
The effects of climate change vary from state to state. As we see above, different states face different challenges. States like California face a grave danger of forest fires, whose frequency as we see has increased in recent years. Those states, closer to the coast like Alabama, Florida, Louisiana, North and South Carolina face an upsurge in tsunamis and hurricanes. However, in the northern states like Minnesota and Indiana, the regular severe snowstorms have given way to flooding and hurricanes, which too are results of global warming. On further investigation, we see that even though fires were initially limited to frequent and annual occurrences in the west coast, the dry climate which causes this fire, is engulfing the country and is now a normal occurrence in the mid-west and is spreading to the east coast as well.
Wildfires rampaging through California
2020
"Now you see how disastrous the consequences of climate change are? "
"Yes, that was truly terrifying! The global effects of climate change are very dangerous indeed. But are all the countries equally affected by climate change ? And are all the countries equally responsible for climate change?"
"No, the countries with higher population and GDP generally have higher CO2 emissions. The asnwer for the other question is not straightforward. According to the Intergovernmental Panel on Climate Change, the extent of climate change effects on individual regions will vary over time and with the ability of different societal and environmental systems to mitigate or adapt to change."
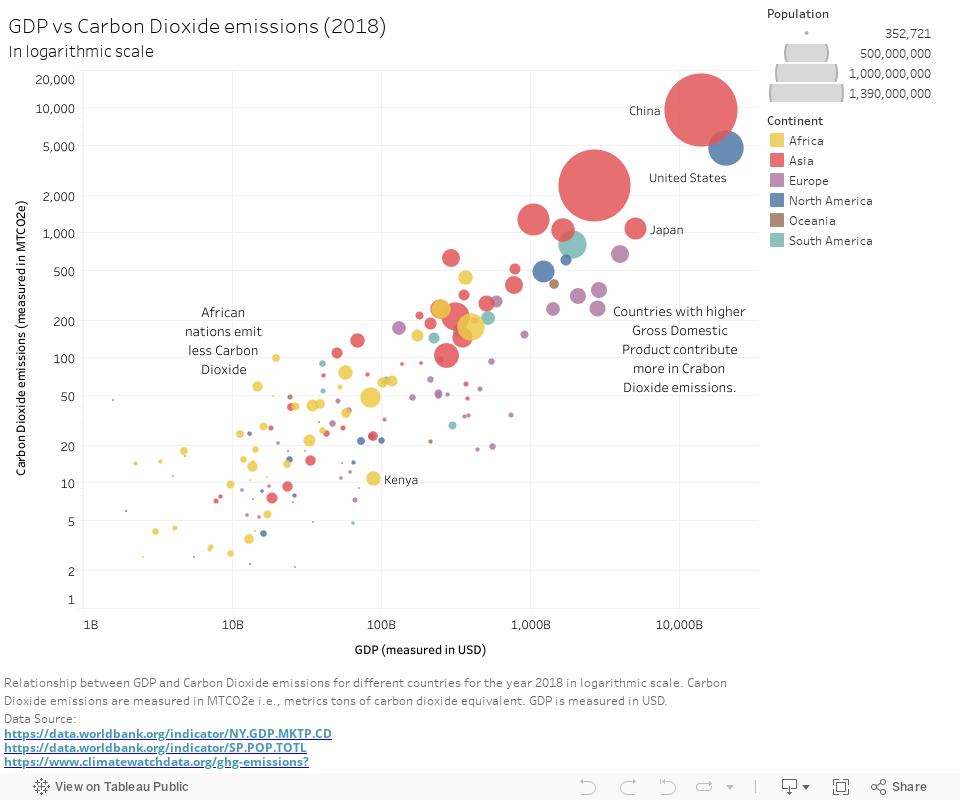
Looking at the positive correlation between the GDP and Carbon Dioxide emissions for 2018 it is evident that the richer countries i.e. those having a higher Gross Domestic Product (GDP) contribute more towards Carbon Dioxide emissions. The emissions are also correlated with the population of a country highlighting the fact that human activities do lead to greenhouse gas emissions. It can also be seen that the African nations contribute little towards Carbon Dioxide emissions. As a result, not all countries are equally responsible for greenhouse gas emissions. The Asian countries that have a growing industrial sector and have moved towards globalization and industrialization contribute to the Carbon Dioxide emissions more. Many European countries with a smaller population contribute greatly or almost equal to countries with a larger population with a similar GDP. However, the climate agreements do not focus much on per-capita emissions, leading to reluctance from developing countries to join the pact.
CO2 emissions vs Vulnerability
The ND-GAIN (Notre Dame Global Adaptation Initiative) Country Index summarizes a country's vulnerability to climate change and other global challenges in combination with its readiness to improve resilience. It helps governments, businesses and communities examine risks exacerbated by climate change, such as overcrowding, food insecurity, inadequate infrastructure, and civil conflicts. It uses 20 years of data across 45 indicators to rank 181 countries annually based on their level of vulnerability, and their readiness to successfully implement adaptation solutions.
Many countries in Africa have a low ND-Gain country index, followed by countries in South America. An important observation that can be made from the scatterplot is that these African countries have very low CO2 emissions. This means that these countries do not contribute much to the climate change, but are most vulnerable to its effects. We can also see that most of the European countries lie in the top 50 percentile of ND-Gain index, meaning they are less vulnerable to climate change. Among the top CO2 contributors, we can see that USA, China, and Russia are not very vulnerable while India is quite vulnerable to the effects of climate change.
"So looking at all this, what do you think Doland? Are you convinced that Climate Change is real?"
"......."
CLIMATE CHANGE IS NOT REAL!
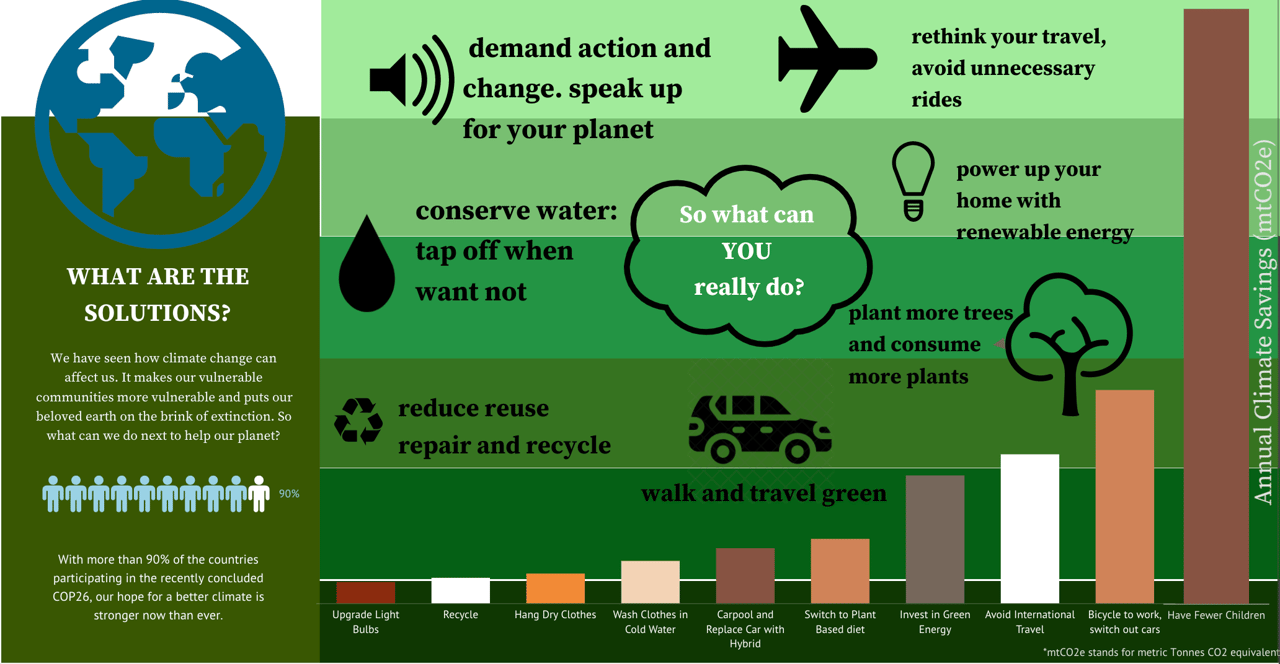
Is it too late to prevent climate change?
Climate change is one of the most complex issues facing us today. It involves many dimensions – science, economics, society, politics and moral and ethical questions – and is a global problem, felt on local scales, that will be around for decades and centuries to come. Carbon dioxide, the heat-trapping greenhouse gas that has driven recent global warming, lingers in the atmosphere for hundreds of years, and the planet (especially the oceans) takes a while to respond to warming. So even if we stopped emitting all greenhouse gases today, global warming and climate change will continue to affect future generations. In this way, humanity is “committed” to some level of climate change.
How much climate change?
That will be determined by how our emissions continue and exactly how our climate system responds to those emissions. Despite increasing awareness of climate change, our emissions of greenhouse gases continue on a relentless rise. In 2013, the daily level of carbon dioxide in the atmosphere surpassed 400 parts per million for the first time in human history. The last time levels were that high was about three to five million years ago, during the Pliocene Epoch.